A concept map or conceptual diagram is a diagram that depicts suggested relationships between concepts that represent ideas and information as boxes and circles with labeled arrows in a downward-branching hierarchical structure. It is a graphical tool that instructional designers, engineers, technical writers, and others use to organize and structure knowledge.
Concept mapping was developed by Joseph D. Novak in the 1970s as a means of representing the emerging science knowledge of students. It has subsequently been used as a tool to increase meaningful learning in the sciences and other subjects as well as to represent the expert knowledge of individuals and teams in education, government and business. Concept maps have their origin in the learning movement called constructivism. In particular, constructivists hold that learners actively construct knowledge.
Concept maps are used to stimulate the generation of ideas and are believed to aid creativity. Such mapping is also sometimes used for brain-storming. Although they are often personalized and idiosyncratic, concept maps can be used to communicate complex ideas and we can use it for wide variety of areas, to just name a few:
Concept map can be a map, a system view, of a real (abstract) system or set of concepts. Concept maps are more free form, as multiple hubs and clusters can be created, unlike mind maps, which typically emerge from a single center.
Topic map – Concept maps are rather similar to topic maps in that both allow to connect concepts or topics via graphs.
Mind map reflects what you think about a single topic, which can focus on group brainstorming.
Concept maps are visual representations of information that are especially useful for those who learn better visually. They are a powerful brainstorming strategy by starting with higher-level concepts and also help you chunk information based on meaningful connections. In other words, knowing the big picture makes details more significant and easier to remember. Concept maps work very well when it is important to see and understand the relationships between different things. They can also be used to analyze, compare and contract information.
Making one is very simple and there is no right or wrong way to make a concept map. The one key step is to focus on the ways ideas are linked to each other. You try following the steps listed below:
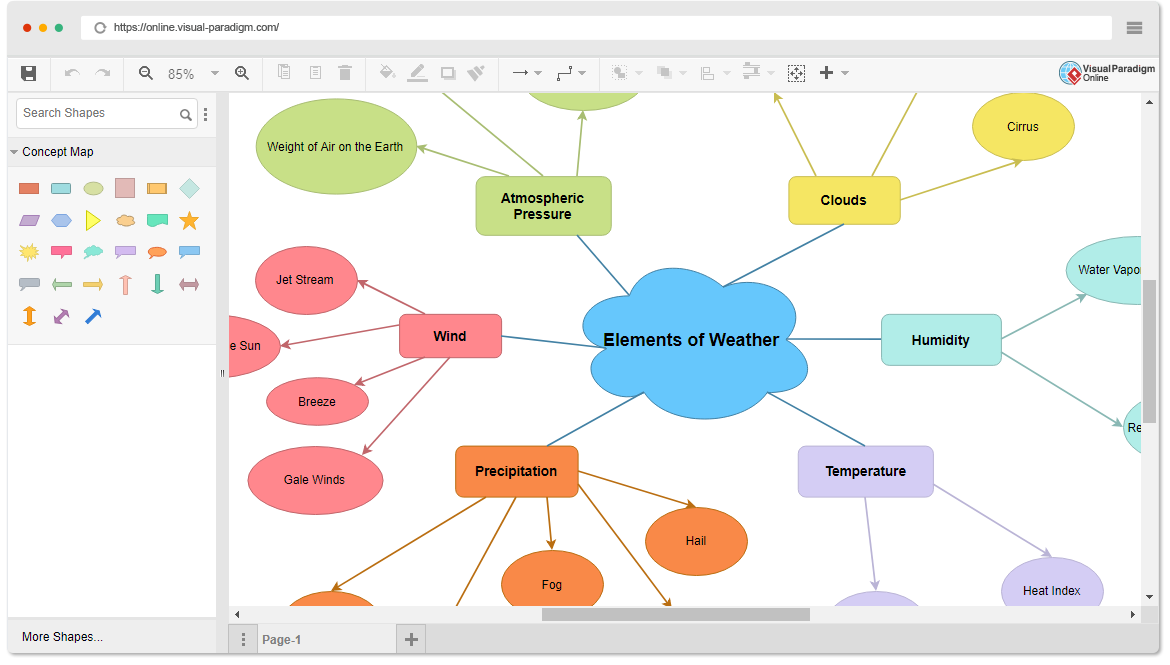
Edit this Concept Map Template
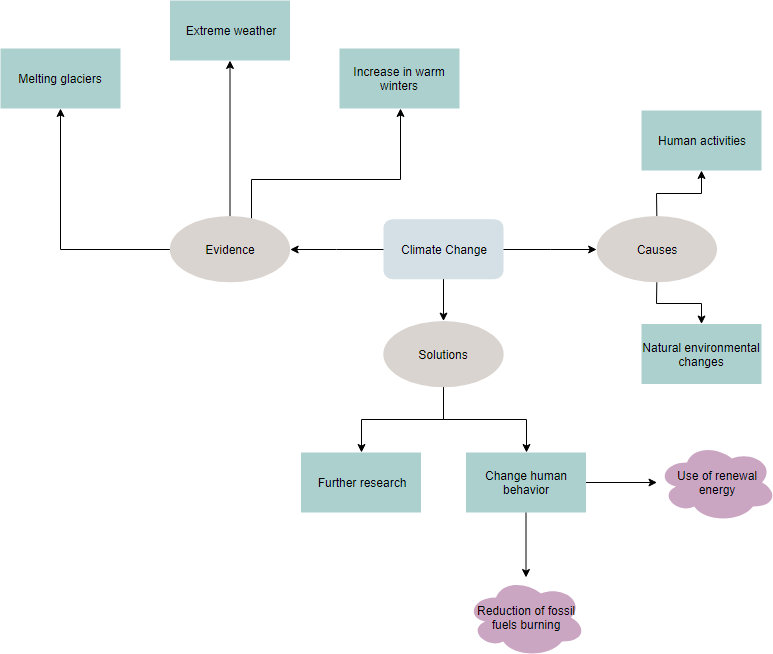
A Concept Map is a visual representation that shows the relationship between ideas, concepts, images, and other related information. It is a popular method used by brainstorming new ideas and innovation as it makes it easy for people to organize, structure and display the knowledge they have gained on a particular subject. Concept maps are often used as a way to develop logical thinking by revealing connections among these concepts to form a larger whole in an easy-to-understand and easy-to-remember structure.
A concept map is a visual organization and representation of knowledge. It shows concepts and ideas and the relationships among them. You create a concept map by writing keywords (sometimes enclosed in shapes such as circles, boxes, triangles, etc.) and then drawing arrows between the ideas that are related. Then you add a short explanation by the arrow to explain how the concepts are related. You can follow the steps listed below for creating a concept map:
Visual Paradigm Online allows you to visually depict a system of relationships by creating a map in which nodes represent ideas or facts, and lines or connectors between nodes represent relationships (for example, cause-and-effect relationships, category and sub-category relationships, and so on).
VP Online comes with a simple drag-and-drop editor that lets you build beautiful Concept Maps effortlessly. It is so intuitive that allows you to pay more attention to the design itself without spending a lot of time learning the software.